Free calculator · Liquidity pools
Impermanent loss calculator
Impermanent loss is how much less a 50/50 liquidity-pool position is worth than simply holding the same two tokens after their prices diverge. In a Uniswap v2-style pool it equals 2√r ÷ (1 + r) − 1, where r is the new price ratio divided by the old one: a 2× move costs 5.72% before fees.
Published 25 September 2026 · Educational tool, not financial advice · No wallet connection needed
Calculate your impermanent loss
50/50 constant-product pool (Uniswap v2 and forks). Full-range liquidity only.
Result
Updates as you type. Values are in US dollars.
Default example (hypothetical): $10,000 deposit, token A +100.00%, token B 0.00%, 90 days, 10% fee APR.
- Value if you had held
- $15,000.00
- Value in the pool (before fees)
- $14,142.14
- Impermanent loss
- −5.72% (−$857.86)
- Token A in your position
- −29.29%
- Token B in your position
- +41.42%
- Fee APR needed to break even over 90 days
- 24.60%
- Fees earned at your fee APR
- $348.71
- Pool position plus fees vs holding
- −$509.15
At this fee APR, fees do not cover the impermanent loss: holding would have been $509.15 better.
Impermanent loss is measured against holding the same tokens, not against cash. Both can lose money if prices fall. Excludes gas, swap costs, rewards and tax.
Worked example (hypothetical): ETH doubles against USDC
Suppose you deposit $10,000 into a 50/50 ETH/USDC pool: $5,000 of ETH and $5,000 of USDC. The ETH price then doubles while USDC stays at $1, and you stay in the pool for 90 days. The numbers are illustrative, not a forecast.
- Held outside the pool, your tokens would be worth $5,000 × 2 + $5,000 = $15,000.
- Inside the pool, arbitrage traders rebalance the position to $10,000 × √2 = $14,142.14, still split 50/50 by value. You now own 29.29% less ETH and 41.42% more USDC than you deposited.
- The gap, $857.86, is the impermanent loss: 5.72% of what holding would be worth.
- To break even over 90 days, the position needs $857.86 in fees, a simple fee APR of 24.60% on its value.
- At a hypothetical 10% fee APR it would earn $348.71, leaving it $509.15 behind simply holding.
A halving of ETH gives the same 5.72% loss, because a price ratio of 0.5 is a 2× move in the other direction. What matters is how far the two prices move apart, not which way.
The formula, step by step
The calculator uses the standard result for a constant-product pool, the same formula quoted in Uniswap's v2 documentation on returns.
- Price ratio. r = (1 + change in token A) ÷ (1 + change in token B). If ETH rises 100% and USDC is flat, r = 2 ÷ 1 = 2. If both tokens rise 30%, r = 1 and there is no impermanent loss.
- Value if held. Hold = deposit ÷ 2 × (1 + change in A) + deposit ÷ 2 × (1 + change in B).
- Value in the pool. The pool keeps the product of its two token balances constant (apart from fees), and arbitrage keeps both sides equal in value at the market price. Solving those two conditions gives pool value = deposit × √((1 + change in A) × (1 + change in B)).
- Impermanent loss. Pool ÷ hold − 1 simplifies to 2√r ÷ (1 + r) − 1. It depends only on r, and r and 1 ÷ r give the same loss.
- Break-even fee APR. Fees needed = hold − pool. Break-even APR = fees needed ÷ pool value × 365 ÷ days × 100, a simple rate that ignores compounding.
In a constant-product pool the loss depends only on the starting and ending prices, not on the path between them. The fees you earn do depend on the path, because they come from trading volume.
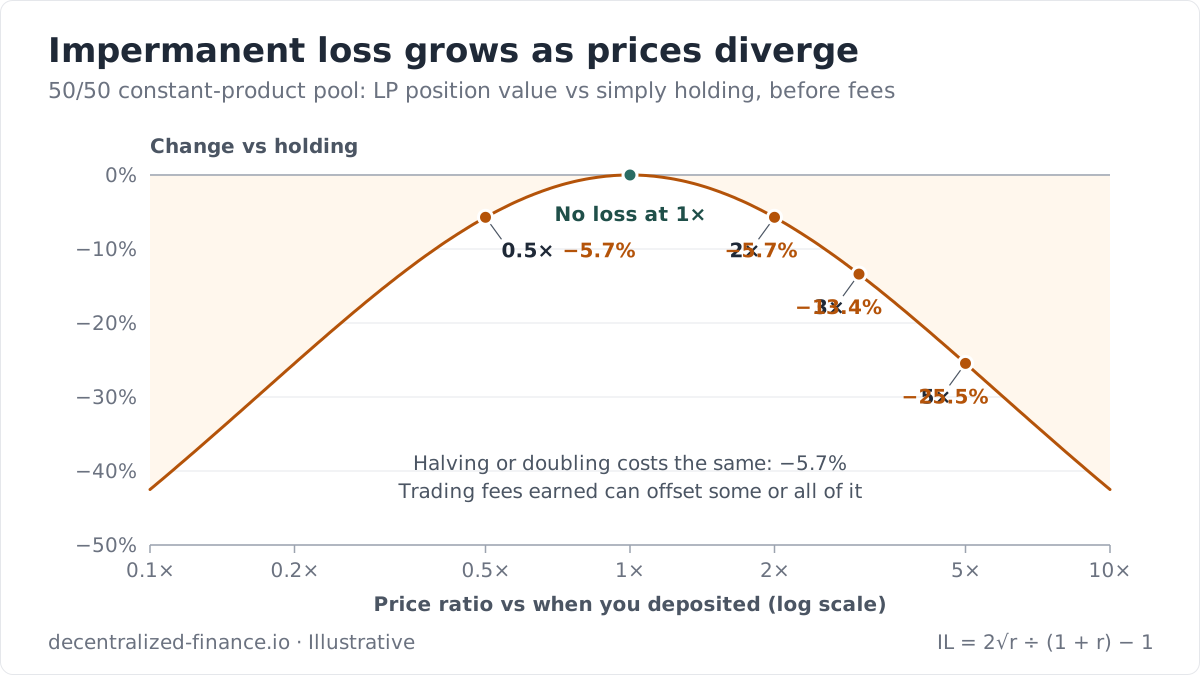
Impermanent loss at common price moves
Token A moves by the amount shown; token B is unchanged. Dollar columns assume a $10,000 deposit and exclude fees.
| Token A move | If held | In pool | Loss |
|---|---|---|---|
| −90.00% | $5,500.00 | $3,162.28 | −42.50% |
| −75.00% | $6,250.00 | $5,000.00 | −20.00% |
| −50.00% | $7,500.00 | $7,071.07 | −5.72% |
| −25.00% | $8,750.00 | $8,660.25 | −1.03% |
| −10.00% | $9,500.00 | $9,486.83 | −0.14% |
| +10.00% | $10,500.00 | $10,488.09 | −0.11% |
| +25.00% | $11,250.00 | $11,180.34 | −0.62% |
| +50.00% | $12,500.00 | $12,247.45 | −2.02% |
| +100.00% | $15,000.00 | $14,142.14 | −5.72% |
| +200.00% | $20,000.00 | $17,320.51 | −13.40% |
| +400.00% | $30,000.00 | $22,360.68 | −25.46% |
Small moves cost little: a 10% rise costs about a tenth of one per cent. The loss accelerates with larger moves, which is why volatile pairs need much higher fee income than correlated pairs to beat holding.
Concentrated liquidity (Uniswap v3 and v4) is not modelled
This calculator assumes full-range liquidity. Uniswap v3 and v4 let you place liquidity in a price range you choose. Inside that range your deposit behaves like a much larger full-range position, and the narrower the range, the bigger the multiple. That raises the fees you earn per dollar while the price stays in range, and it raises the divergence loss by the same leverage, so a given price move costs a larger share of your deposit than the figures above.
When the price leaves your range, Uniswap's documentation explains that the position stops earning fees and ends up entirely in one token: the one that fell in relative value. For a v3 or v4 position, treat the full-range result as a floor on the loss for that price move, not an estimate. Our guide to providing liquidity on Uniswap v3 covers range choice in more detail.
What this model leaves out
- Real fee income. Fees are modelled as one constant, simple APR. In practice they vary with trading volume and pool size, and past fee rates do not predict future ones.
- Price ranges. Concentrated liquidity positions, as explained above.
- Other pool designs. Weighted pools (for example 80/20) and stableswap curves have different loss curves.
- Rebalancing and top-ups. The model assumes one deposit held to the end. Adding or withdrawing liquidity, moving a range or rebalancing your own holdings resets the starting prices, so each change needs its own calculation.
- Gas and swap costs. Approvals, deposits, withdrawals and any swaps to get a 50/50 split all cost money, which matters most for small deposits.
- Rewards, tax and protocol risk. Incentive tokens, tax treatment, smart-contract bugs and token failures are outside the maths.
How to use this safely
- Run a large rise and a large fall of the volatile token, not just the move you expect.
- Compare the break-even fee APR with the pool's fee history over weeks or months. A single day's fees, annualised, can be misleading.
- Correlated pairs, such as two stablecoins, usually move apart less. A depeg is exactly when they do, so test a -10% or -50% move for one side.
- Add your gas and swap costs to the fees needed, especially on Ethereum mainnet or for deposits under a few thousand dollars.
- Use the pool's official interface and check the token contract addresses. Copycat tokens and pools are common.
Impermanent loss calculator FAQs
What is impermanent loss in simple terms?
Is impermanent loss permanent?
Can trading fees make up for impermanent loss?
Do stablecoin pairs have impermanent loss?
Why is impermanent loss higher on Uniswap v3 and v4?
Does this calculator work for Curve or Balancer pools?
Related guides and tools
- What is impermanent loss?
The concept in plain English, with examples.
- What is an AMM?
How automated market makers price trades.
- What is a liquidity pool?
Where LP tokens and fees come from.
- How to provide liquidity on Uniswap v3
Choosing and managing a price range.
- Uniswap protocol guide
Versions, fees and risks of the largest DEX.
- Curve protocol guide
Stableswap pools and how they differ.
- Aave health factor calculator
Liquidation price for a lending position.
- DeFi risk and net yield calculator
Collateral stress and break-even APY.
Primary sources: Uniswap v2: understanding returns and Uniswap: concentrated liquidity. This calculator is educational and is not financial advice.